|
| |
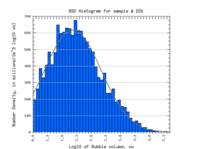
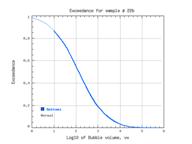
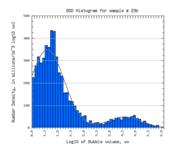
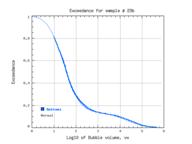
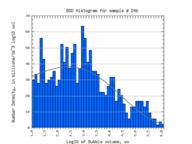
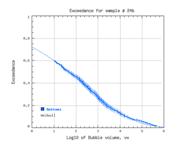
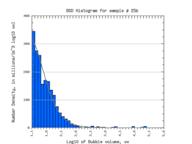
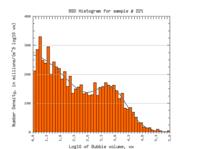
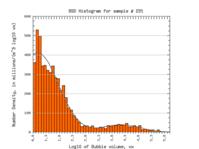
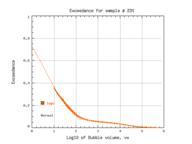
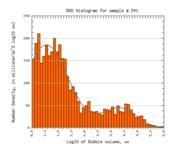
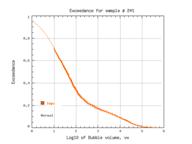
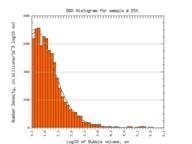
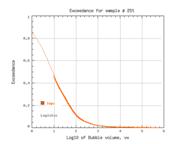
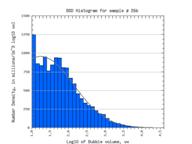
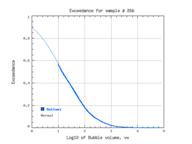
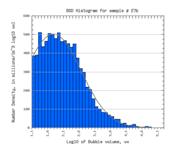
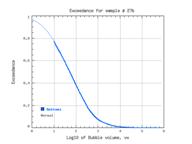
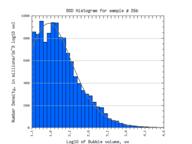
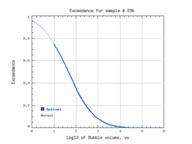
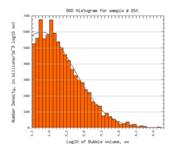
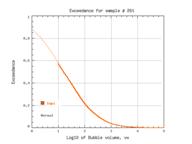
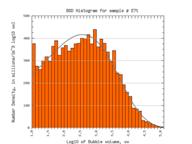
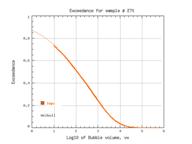
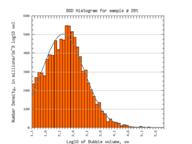
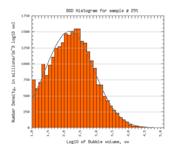
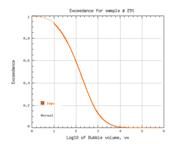
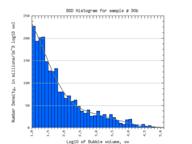
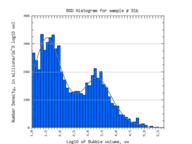
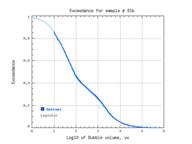
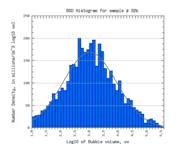
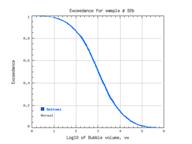
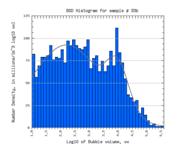
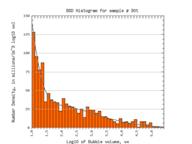
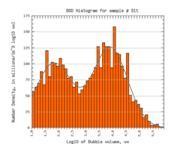
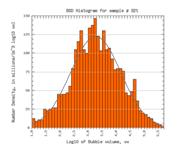
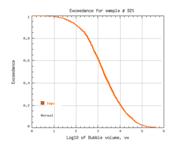
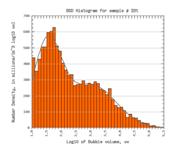
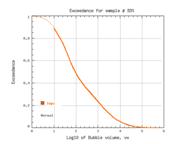
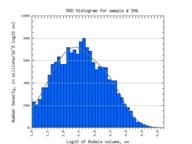
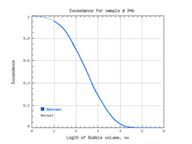
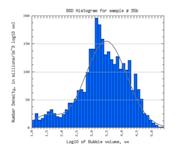
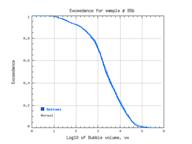
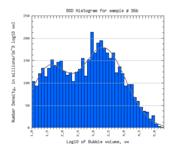
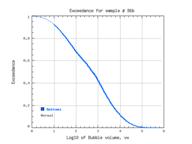
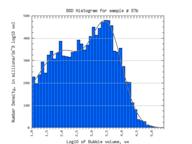
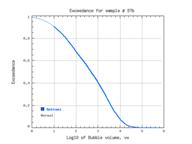
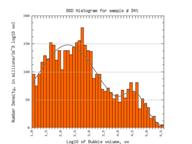
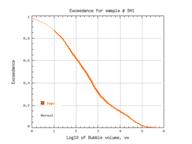
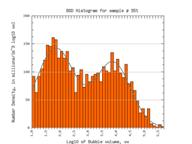
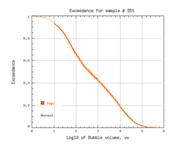
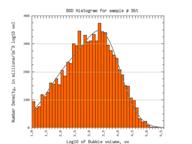
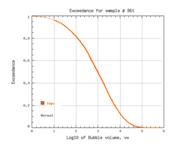
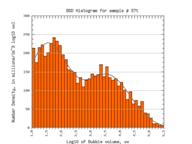
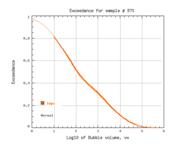
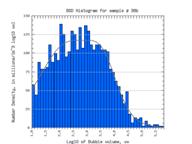
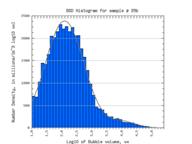
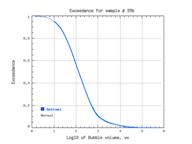
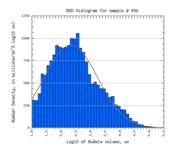
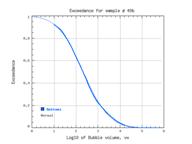
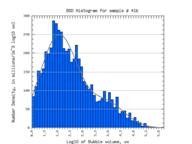
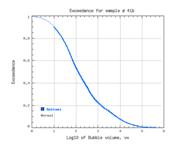
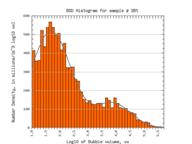
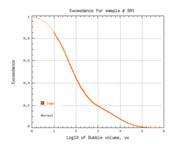
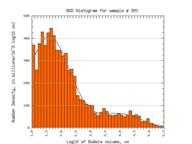
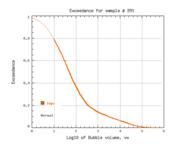
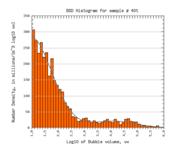
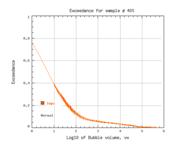
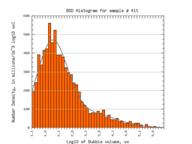
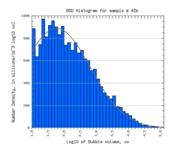
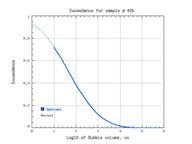
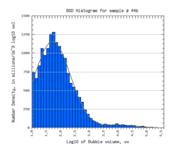
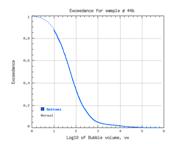
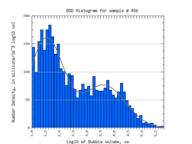
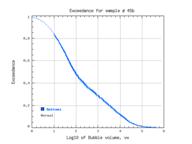
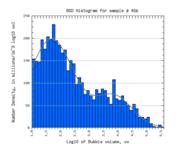
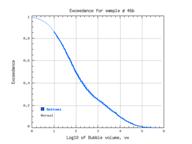
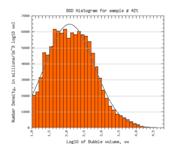
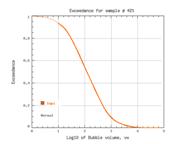
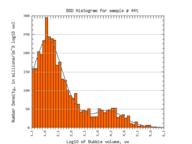
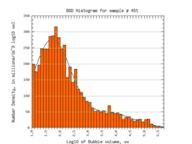
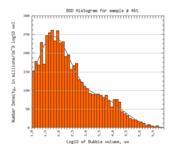
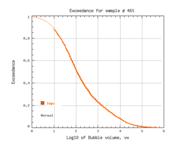
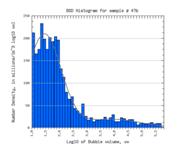
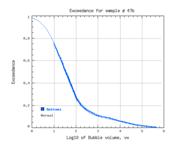
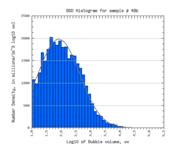
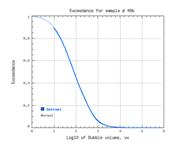
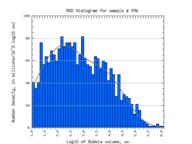
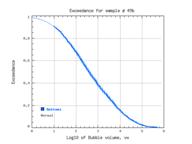
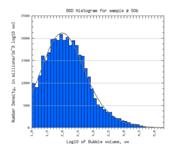
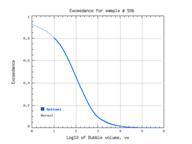
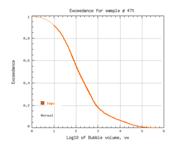
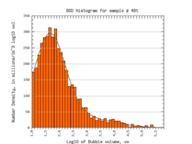
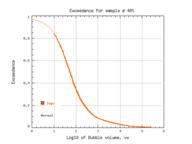
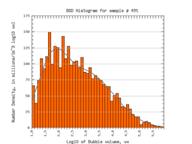
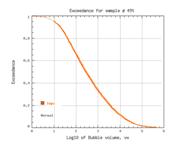
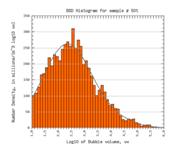
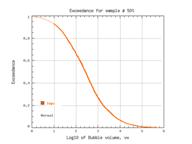
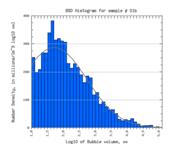
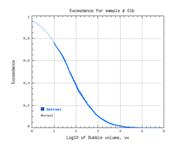
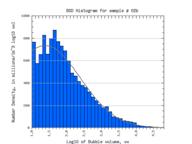
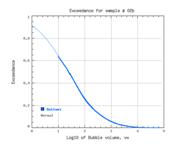
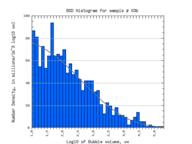
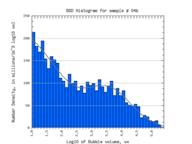
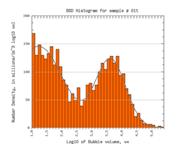
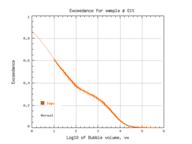
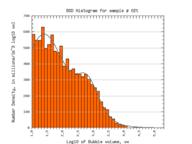
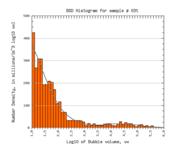
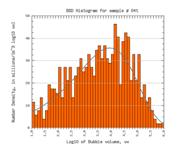
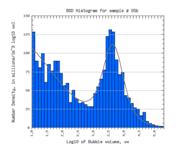
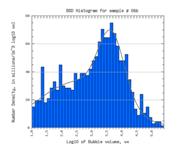
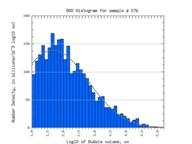
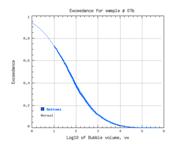
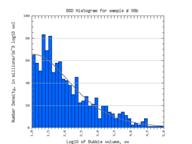
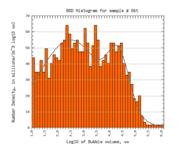
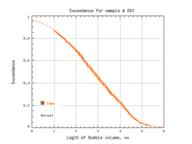
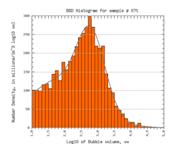
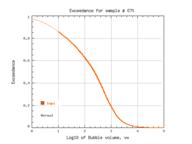
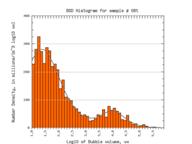
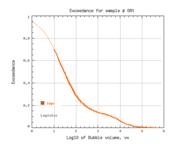
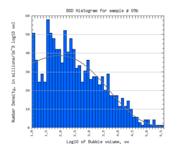
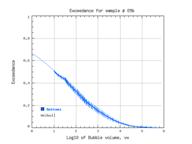
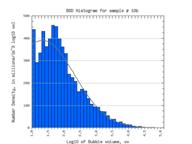
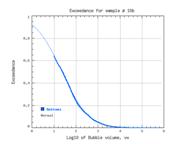
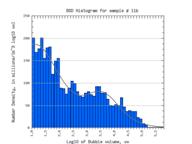
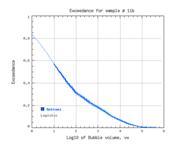
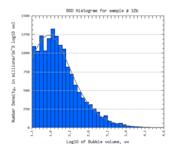
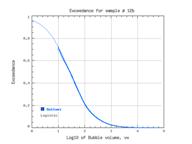
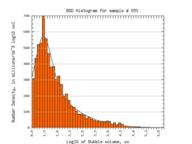
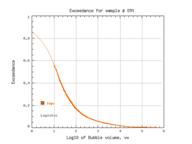
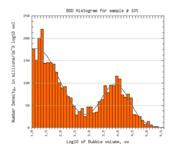
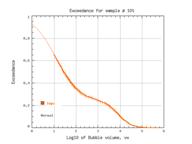
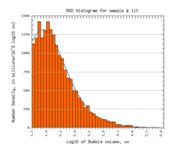
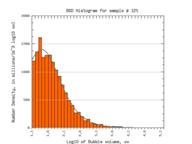
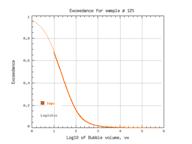
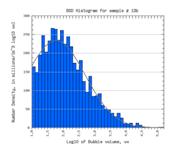
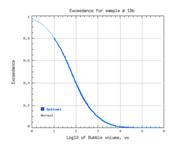
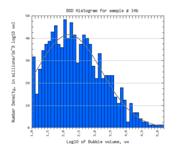
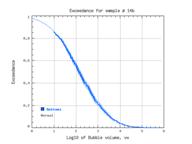
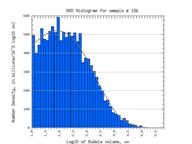
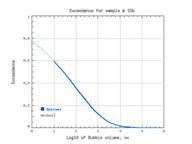
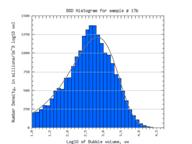
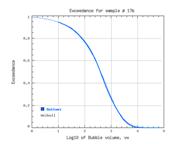
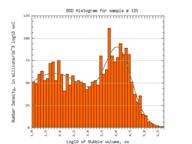
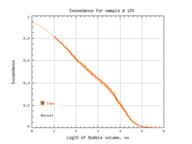
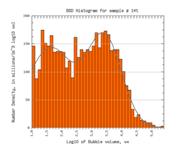
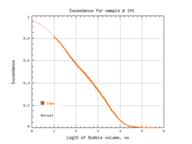
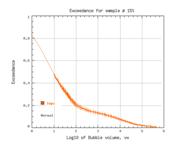
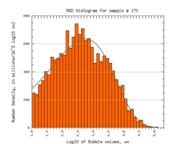
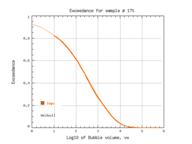
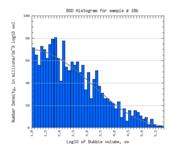
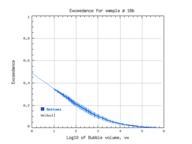
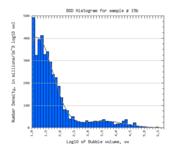
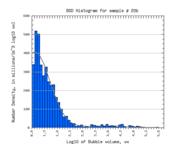
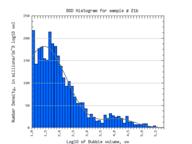
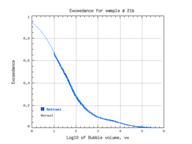
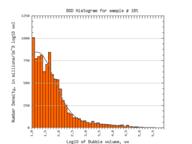
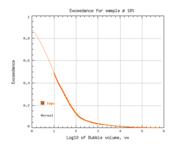
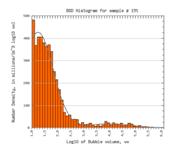
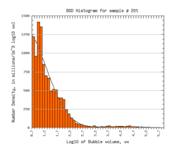
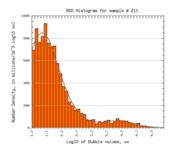
Table 1. Best fit functions of statistical distributions for bubble populations in basalt samples
from Colorado Plateau.
|
Sample |
Mode 1 |
Mode 2 |
Mean
Chi-Square |
Void Fraction, % |
Method |
Distribution |
|
Sigma |
v |
BND, 109
or
Fraction |
Sigma |
v |
BND, 109
or
Fraction |
Observed |
Calculated |
|
01b |
- |
- |
- |
1.022 |
1.709 |
0.734 |
2.405 |
6.036 |
5.826 |
Density |
Normal |
| - |
- |
- |
1.013 |
1.721 |
1.000 |
2.107* |
- |
- |
Exceedance |
|
01t |
0.801 |
1.223 |
0.292 |
0.503 |
3.617 |
0.154 |
1.145 |
13.799 |
11.583 |
Density |
Normal |
| 1.057 |
0.948 |
0.738 |
0.484 |
3.667 |
0.262 |
0.467* |
- |
- |
Exceedance |
|
02b |
1.013 |
1.378 |
1.866 |
- |
- |
- |
3.610 |
5.913 |
6.512 |
Density |
Normal |
| 1.012 |
1.369 |
1.000 |
- |
- |
- |
5.147* |
- |
- |
Exceedance |
|
02t |
0.464 |
1.385 |
1.079 |
0.255 |
2.812 |
0.235 |
1.731 |
7.097 |
24.362 |
Density |
Logistic |
| 0.508 |
1.290 |
0.830 |
0.268 |
2.752 |
0.170 |
2.692* |
- |
- |
Exceedance |
|
03b |
2.383 |
0.357 |
0.512 |
- |
- |
- |
1.087 |
3.799 |
3.270 |
Density |
Weibull |
| 2.451 |
0.299 |
1.000 |
- |
- |
- |
0.555* |
- |
- |
Exceedance |
|
03t |
0.495 |
0.714 |
0.793 |
0.424 |
4.441 |
0.029 |
1.615 |
29.266 |
64.845 |
Density |
Logistic |
|
04b |
1.231 |
0.595 |
0.641 |
0.749 |
3.576 |
0.152 |
0.896 |
23.813 |
21.654 |
Density |
Normal |
| 04t |
- |
- |
- |
1.163 |
3.950 |
0.113 |
0.852 |
30.224 |
29.602 |
Density |
Weibull |
| - |
- |
- |
1.276 |
3.998 |
1.000 |
0.133* |
- |
- |
Exceedance |
| 05b |
0.852 |
0.447 |
0.403 |
0.225 |
3.640 |
0.091 |
1.609 |
9.823 |
99.980 |
Density |
Logistic |
| 05t |
0.507 |
0.262 |
0.145 |
0.408 |
4.480 |
0.029 |
0.880 |
32.209 |
54.287 |
Density |
Logistic |
| 06b |
1.284 |
2.479 |
0.105 |
0.436 |
3.650 |
0.052 |
0.862 |
10.298 |
22.954 |
Density |
Normal |
| 1.326 |
2.416 |
0.671 |
0.454 |
3.668 |
0.329 |
0.071* |
- |
- |
Exceedance |
| 06t |
1.237 |
2.494 |
0.170 |
0.412 |
4.360 |
0.034 |
0.611 |
26.466 |
30.567 |
Density |
Normal |
| 1.447 |
2.555 |
0.892 |
0.364 |
4.298 |
0.108 |
0.186* |
- |
- |
Exceedance |
| 07b |
1.105 |
1.678 |
0.384 |
- |
- |
- |
1.071 |
4.089 |
4.590 |
Density |
Normal |
| 1.106 |
1.684 |
1.000 |
- |
- |
- |
0.772* |
- |
- |
Exceedance |
| 07t |
0.984 |
1.811 |
0.311 |
0.421 |
2.793 |
0.205 |
0.740 |
4.304 |
4.576 |
Density |
Normal |
| 1.026 |
1.743 |
0.596 |
0.428 |
2.782 |
0.404 |
0.150* |
- |
- |
Exceedance |
| 08b |
0.769 |
1.034 |
0.202 |
- |
- |
- |
1.142 |
4.663 |
99.895 |
Density |
Logistic |
| 0.777 |
1.061 |
1.000 |
- |
- |
- |
0.598* |
- |
- |
Exceedance |
| 08t |
0.457 |
1.369 |
0.512 |
0.306 |
3.997 |
0.069 |
1.241 |
19.754 |
22.974 |
Density |
Logistic |
| 0.484 |
1.336 |
0.888 |
0.280 |
4.043 |
0.112 |
0.515* |
- |
- |
Exceedance |
| 09b |
- |
- |
- |
1.802 |
1.954 |
0.190 |
0.943 |
7.171 |
5.022 |
Density |
Weibull |
| - |
- |
- |
1.957 |
1.776 |
1.000 |
0.462* |
- |
- |
Exceedance |
| 09t |
0.238 |
1.246 |
0.396 |
0.729 |
1.573 |
0.476 |
1.638 |
14.196 |
99.946 |
Density |
Logistic |
| 10b |
0.995 |
1.327 |
0.974 |
- |
- |
- |
2.855 |
3.283 |
2.853 |
Density |
Normal |
| 0.967 |
1.361 |
1.000 |
- |
- |
- |
3.905* |
- |
- |
Exceedance |
| 10t |
0.794 |
1.166 |
0.352 |
0.507 |
3.901 |
0.123 |
1.188 |
19.903 |
16.825 |
Density |
Normal |
| 0.840 |
1.090 |
0.753 |
0.506 |
3.904 |
0.247 |
0.350* |
- |
- |
Exceedance |
| 11b |
0.597 |
1.102 |
0.443 |
0.429 |
3.563 |
0.118 |
1.867 |
20.157 |
94.885 |
Density |
Logistic |
| 0.702 |
0.959 |
0.834 |
0.437 |
3.663 |
0.166 |
0.858* |
- |
- |
Exceedance |
| 11t |
0.535 |
1.492 |
2.811 |
- |
- |
- |
2.085 |
16.804 |
95.440 |
Density |
Logistic |
| 0.567 |
1.394 |
1.000 |
- |
- |
- |
5.442* |
- |
- |
Exceedance |
| 12b |
0.406 |
1.545 |
2.008 |
- |
- |
- |
3.406 |
3.510 |
8.527 |
Density |
Logistic |
| 0.448 |
1.422 |
1.000 |
- |
- |
- |
14.781* |
- |
- |
Exceedance |
| 12t |
0.387 |
1.400 |
2.167 |
- |
- |
- |
2.366 |
5.407 |
4.419 |
Density |
Logistic |
| 0.414 |
1.314 |
1.000 |
- |
- |
- |
10.404* |
- |
- |
Exceedance |
| 13b |
0.925 |
1.766 |
0.542 |
- |
- |
- |
1.659 |
4.650 |
3.057 |
Density |
Normal |
| 0.921 |
1.78 |
1.000 |
- |
- |
- |
1.240* |
- |
- |
Exceedance |
| 13t |
1.300 |
1.791 |
0.198 |
0.482 |
4.077 |
0.093 |
0.799 |
21.332 |
24.392 |
Density |
Normal |
| 1.300 |
1.797 |
0.680 |
0.475 |
4.084 |
0.320 |
0.094* |
- |
- |
Exceedance |
| 14b |
- |
- |
- |
1.048 |
2.176 |
0.109 |
0.742 |
2.528 |
3.005 |
Density |
Normal |
| - |
- |
- |
1.073 |
2.155 |
1.000 |
0.173* |
- |
- |
Exceedance |
| 14t |
0.758 |
1.613 |
0.271 |
0.575 |
3.415 |
0.232 |
1.666 |
14.338 |
13.368 |
Density |
Normal |
| 1.035 |
1.630 |
0.666 |
0.530 |
3.517 |
0.334 |
0.595* |
- |
- |
Exceedance |
| 15b |
- |
- |
- |
1.454 |
1.927 |
2.055 |
1.424 |
18.205 |
14.444 |
Density |
Weibull |
| - |
- |
- |
1.434 |
1.951 |
1.000 |
1.277* |
- |
- |
Exceedance |
| 15t |
0.670 |
1.184 |
0.222 |
0.866 |
3.976 |
0.060 |
1.326 |
28.938 |
29.832 |
Density |
Normal |
| 0.916 |
0.765 |
0.868 |
0.801 |
4.083 |
0.132 |
0.741* |
- |
- |
Exceedance |
| 17b |
- |
- |
- |
0.663 |
2.833 |
2.185 |
4.375 |
17.944 |
17.181 |
Density |
Weibull |
| - |
- |
- |
0.643 |
2.834 |
1.000 |
5.022* |
- |
- |
Exceedance |
| 17t |
- |
- |
- |
1.067 |
2.738 |
1.841 |
3.034 |
25.642 |
24.745 |
Density |
Weibull |
| - |
- |
- |
1.06 |
2.743 |
1.000 |
2.467* |
- |
- |
Exceedance |
| 18b |
2.646 |
0.728 |
0.508 |
- |
- |
- |
1.070 |
13.260 |
19.379 |
Density |
Weibull |
| 2.624 |
0.864 |
1.000 |
- |
- |
- |
0.339* |
- |
- |
Exceedance |
| 18t |
0.660 |
1.185 |
1.388 |
0.976 |
3.153 |
0.114 |
2.648 |
23.138 |
17.698 |
Density |
Normal |
| 0.844 |
0.961 |
0.972 |
0.548 |
3.952 |
0.028 |
6.318* |
- |
- |
Exceedance |
| 19b |
0.563 |
1.183 |
0.569 |
0.768 |
3.545 |
0.058 |
1.692 |
9.765 |
9.210 |
Density |
Normal |
| 0.726 |
0.936 |
0.944 |
0.636 |
3.842 |
0.056 |
3.456* |
- |
- |
|
| 19t |
0.587 |
1.233 |
0.628 |
0.847 |
4.016 |
0.038 |
1.521 |
17.580 |
21.433 |
Density |
Normal |
| 0.657 |
1.154 |
0.953 |
0.667 |
4.206 |
0.047 |
3.073* |
- |
- |
Exceedance |
| 20b |
0.612 |
0.906 |
0.621 |
0.924 |
3.713 |
0.024 |
2.042 |
24.294 |
11.098 |
Density |
Normal |
| 20t |
0.860 |
0.410 |
2.842 |
0.780 |
4.203 |
0.037 |
5.194 |
20.139 |
23.720 |
Density |
Normal |
| 21b |
0.813 |
1.441 |
0.371 |
0.613 |
4.123 |
0.030 |
1.461 |
12.030 |
10.566 |
Density |
Normal |
| 0.904 |
1.353 |
0.936 |
0.516 |
4.221 |
0.064 |
1.874* |
- |
- |
Exceedance |
| 21t |
0.386 |
1.546 |
1.309 |
0.322 |
4.112 |
0.080 |
1.731 |
20.164 |
27.565 |
Density |
Logistic |
| 0.455 |
1.402 |
0.963 |
0.227 |
4.261 |
0.037 |
6.837* |
- |
- |
Exceedance |
| 22b |
- |
- |
- |
0.972 |
2.164 |
1.504 |
2.479 |
21.037 |
21.692 |
Density |
Normal |
| - |
- |
- |
1.010 |
2.126 |
1.000 |
1.909* |
- |
- |
Exceedance |
| 22t |
1.546 |
0.657 |
1.039 |
0.573 |
3.686 |
0.166 |
1.245 |
26.204 |
32.146 |
Density |
Normal |
| 23b |
0.654 |
1.395 |
0.570 |
0.647 |
4.390 |
0.079 |
1.504 |
33.830 |
37.819 |
Density |
Normal |
| 0.570 |
1.438 |
0.856 |
0.726 |
4.233 |
0.144 |
1.536* |
- |
- |
Exceedance |
| 23t |
0.786 |
0.973 |
0.810 |
0.706 |
4.161 |
0.069 |
1.489 |
27.005 |
27.908 |
Density |
Normal |
| 1.011 |
0.568 |
0.955 |
0.558 |
4.349 |
0.045 |
3.576* |
- |
- |
Exceedance |
| 24b |
- |
- |
- |
2.142 |
2.398 |
0.222 |
1.204 |
27.852 |
37.864 |
Density |
Weibull |
| - |
- |
- |
2.196 |
2.469 |
1.000 |
0.836* |
- |
- |
Exceedance |
| 24t |
0.819 |
1.349 |
0.379 |
0.639 |
4.087 |
0.071 |
1.354 |
19.987 |
21.182 |
Density |
Normal |
| 0.857 |
1.362 |
0.852 |
0.589 |
4.167 |
0.148 |
1.169* |
- |
- |
Exceedance |
| 25b |
0.325 |
1.030 |
0.414 |
- |
- |
- |
1.644 |
5.111 |
0.151 |
Density |
Logistic |
| 25t |
0.451 |
1.282 |
1.243 |
- |
- |
- |
1.582 |
20.877 |
13.446 |
Density |
Logistic |
| 0.534 |
0.935 |
1.000 |
- |
- |
- |
9.242* |
- |
- |
Exceedance |
| 26b |
0.886 |
1.246 |
2.122 |
- |
- |
- |
4.831 |
3.026 |
2.989 |
Density |
Normal |
| 0.922 |
1.166 |
1.000 |
- |
- |
- |
12.158* |
- |
- |
Exceedance |
| 26t |
0.946 |
1.371 |
1.418 |
- |
- |
- |
1.868 |
4.194 |
3.559 |
Density |
Normal |
| 1.024 |
1.204 |
1.000 |
- |
- |
- |
6.025* |
- |
- |
Exceedance |
| 27b |
0.882 |
1.782 |
1.110 |
- |
- |
- |
1.631 |
7.384 |
5.147 |
Density |
Normal |
| 0.929 |
1.702 |
1.000 |
- |
- |
- |
3.602* |
- |
- |
Exceedance |
| 27t |
1.216 |
2.572 |
1.375 |
- |
- |
- |
2.143 |
19.049 |
19.871 |
Density |
Weibull |
| 1.269 |
2.530 |
1.000 |
- |
- |
- |
3.584* |
- |
- |
Exceedance |
| 28b |
0.790 |
1.546 |
0.350 |
0.319 |
3.526 |
0.208 |
0.915 |
29.658 |
99.980 |
Density |
Logistic |
| 28t |
0.772 |
2.235 |
0.970 |
0.776 |
4.838 |
0.005 |
1.960 |
15.326 |
20.301 |
Density |
Normal |
| 29b |
0.963 |
1.654 |
1.412 |
- |
- |
- |
1.830 |
7.195 |
7.099 |
Density |
Normal |
| 0.963 |
1.651 |
1.000 |
- |
- |
- |
1.833* |
- |
- |
Exceedance |
| 29t |
0.750 |
2.170 |
2.832 |
- |
- |
- |
4.127 |
15.752 |
16.060 |
Density |
Normal |
| 0.760 |
2.163 |
1.000 |
- |
- |
- |
6.484* |
- |
- |
Exceedance |
| 30b |
0.864 |
0.527 |
0.579 |
0.848 |
2.872 |
0.055 |
0.957 |
2.565 |
2.909 |
Density |
Normal |
| 30t |
0.398 |
0.598 |
0.186 |
1.477 |
1.600 |
0.114 |
1.071 |
4.263 |
13.112 |
Density |
Normal |
| 31b |
0.344 |
1.539 |
0.436 |
0.357 |
3.329 |
0.245 |
1.759 |
19.831 |
21.114 |
Density |
Logistic |
| 0.390 |
1.504 |
0.667 |
0.367 |
3.353 |
0.333 |
1.358* |
- |
- |
Exceedance |
| 31t |
0.671 |
1.815 |
0.170 |
0.643 |
3.902 |
0.202 |
0.899 |
33.773 |
33.313 |
Density |
Normal |
| 0.717 |
1.819 |
0.472 |
0.629 |
3.926 |
0.528 |
0.099* |
- |
- |
Exceedance |
| 32b |
- |
- |
- |
0.929 |
3.016 |
0.392 |
1.170 |
25.243 |
29.171 |
Density |
Normal |
| - |
- |
- |
0.926 |
3.023 |
1.000 |
0.463* |
- |
- |
Exceedance |
| 32t |
- |
- |
- |
0.891 |
3.271 |
0.273 |
0.957 |
24.888 |
30.101 |
Density |
Normal |
| - |
- |
- |
0.897 |
3.268 |
1.000 |
0.357* |
- |
- |
Exceedance |
| 33b |
1.218 |
2.205 |
0.282 |
0.375 |
3.995 |
0.044 |
0.967 |
15.927 |
23.209 |
Density |
Normal |
| 1.330 |
2.209 |
0.894 |
0.304 |
3.960 |
0.106 |
0.359* |
- |
- |
Exceedance |
| 33t |
0.476 |
1.530 |
0.624 |
0.827 |
3.026 |
0.558 |
1.516 |
25.366 |
27.450 |
Density |
Normal |
| 0.554 |
1.514 |
0.588 |
0.795 |
3.117 |
0.412 |
1.360* |
- |
- |
Exceedance |
| 34b |
0.801 |
2.340 |
1.433 |
0.434 |
3.540 |
0.213 |
2.122 |
22.877 |
23.235 |
Density |
Normal |
| 0.839 |
2.374 |
0.904 |
0.406 |
3.531 |
0.096 |
0.596* |
- |
- |
Exceedance |
| 34t |
1.101 |
2.248 |
0.408 |
0.377 |
4.596 |
0.046 |
1.292 |
29.534 |
31.523 |
Density |
Normal |
| 1.174 |
2.269 |
0.920 |
0.309 |
4.664 |
0.080 |
0.387* |
- |
- |
Exceedance |
| 35b |
0.420 |
1.475 |
0.023 |
0.686 |
3.475 |
0.266 |
2.061 |
21.055 |
22.126 |
Density |
Normal |
| 0.322 |
1.424 |
0.063 |
0.715 |
3.468 |
0.937 |
1.171* |
- |
- |
Exceedance |
| 35t |
0.679 |
1.840 |
0.242 |
0.627 |
3.881 |
0.183 |
1.292 |
29.275 |
29.235 |
Density |
Normal |
| 0.691 |
1.848 |
0.576 |
0.632 |
3.912 |
0.424 |
0.198* |
- |
- |
Exceedance |
| 36b |
0.574 |
1.551 |
0.188 |
0.722 |
3.324 |
0.323 |
1.150 |
20.449 |
21.949 |
Density |
Normal |
| 0.603 |
1.485 |
0.359 |
0.755 |
3.292 |
0.641 |
0.148* |
- |
- |
Exceedance |
| 36t |
0.873 |
2.436 |
0.477 |
0.591 |
3.576 |
0.352 |
1.310 |
30.584 |
30.844 |
Density |
Normal |
| 0.932 |
2.423 |
0.561 |
0.638 |
3.522 |
0.439 |
0.294* |
- |
- |
Exceedance |
| 37b |
0.942 |
2.021 |
0.805 |
0.497 |
3.536 |
0.467 |
1.252 |
29.114 |
29.054 |
Density |
Normal |
| 0.970 |
2.015 |
0.642 |
0.497 |
3.541 |
0.358 |
0.222* |
- |
- |
Exceedance |
| 37t |
0.709 |
1.530 |
0.397 |
0.77 |
3.581 |
0.270 |
0.913 |
28.691 |
34.088 |
Density |
Normal |
| 0.852 |
1.500 |
0.661 |
0.733 |
3.672 |
0.339 |
0.543* |
- |
- |
Exceedance |
| 38b |
1.08 |
2.371 |
0.309 |
0.489 |
3.604 |
0.055 |
0.775 |
41.422 |
17.153 |
Density |
Normal |
| 0.905 |
2.004 |
0.599 |
0.719 |
3.436 |
0.401 |
0.063* |
- |
- |
Exceedance |
| 38t |
0.704 |
1.680 |
0.913 |
0.642 |
3.876 |
0.212 |
1.327 |
32.281 |
33.563 |
Density |
Normal |
| 0.727 |
1.672 |
0.822 |
0.619 |
3.909 |
0.178 |
0.806* |
- |
- |
Exceedance |
| 39b |
0.641 |
2.089 |
3.828 |
0.439 |
4.019 |
0.148 |
3.720 |
29.638 |
29.050 |
Density |
Normal |
| 0.663 |
2.097 |
0.973 |
0.206 |
4.089 |
0.027 |
1.355* |
- |
- |
Exceedance |
| 39t |
0.714 |
1.590 |
0.727 |
0.727 |
3.967 |
0.115 |
1.694 |
23.884 |
31.315 |
Density |
Normal |
| 0.771 |
1.560 |
0.884 |
0.629 |
4.074 |
0.116 |
0.807* |
- |
- |
Exceedance |
| 40b |
- |
- |
- |
0.912 |
2.327 |
2.109 |
5.173 |
28.848 |
29.447 |
Density |
Normal |
| - |
- |
- |
0.929 |
2.327 |
1.000 |
4.883* |
- |
- |
Exceedance |
| 40t |
0.815 |
0.941 |
0.582 |
0.839 |
4.092 |
0.044 |
0.828 |
34.807 |
26.651 |
Density |
Normal |
| 0.982 |
0.652 |
0.953 |
0.672 |
4.308 |
0.047 |
1.212* |
- |
- |
Exceedance |
| 41b |
0.726 |
1.864 |
0.450 |
0.712 |
3.734 |
0.119 |
1.292 |
22.765 |
21.208 |
Density |
Normal |
| 0.725 |
1.843 |
0.777 |
0.726 |
3.699 |
0.223 |
0.623* |
- |
- |
Exceedance |
| 41t |
0.569 |
1.844 |
0.621 |
1.043 |
3.168 |
0.203 |
1.592 |
28.248 |
35.968 |
Density |
Normal |
| 0.619 |
1.817 |
0.794 |
1.000 |
3.315 |
0.206 |
1.069* |
- |
- |
Exceedance |
| 42b |
- |
- |
- |
1.048 |
1.765 |
2.334 |
4.202 |
16.540 |
20.454 |
Density |
Normal |
| - |
- |
- |
1.130 |
1.671 |
1.000 |
2.537* |
- |
- |
Exceedance |
| 42t |
- |
- |
- |
0.708 |
2.083 |
11.500 |
15.850 |
35.575 |
35.065 |
Density |
Normal |
| - |
- |
- |
0.713 |
2.080 |
1.000 |
9.294* |
- |
- |
Exceedance |
| 44b |
0.626 |
1.717 |
1.810 |
0.590 |
4.047 |
0.056 |
2.115 |
16.675 |
15.905 |
Density |
Normal |
| 0.623 |
1.709 |
0.963 |
0.845 |
3.891 |
0.037 |
2.568* |
- |
- |
Exceedance |
| 44t |
0.396 |
1.692 |
0.378 |
0.398 |
4.019 |
0.069 |
0.991 |
23.326 |
43.601 |
Density |
Logistic |
| 0.431 |
1.646 |
0.862 |
0.364 |
4.064 |
0.138 |
0.886* |
- |
- |
Exceedance |
| 45b |
0.616 |
1.524 |
0.246 |
0.774 |
3.613 |
0.147 |
1.214 |
21.704 |
23.457 |
Density |
Normal |
| 0.711 |
1.503 |
0.676 |
0.717 |
3.725 |
0.324 |
0.428* |
- |
- |
Exceedance |
| 45t |
0.669 |
1.718 |
0.461 |
0.854 |
3.747 |
0.098 |
1.290 |
21.655 |
28.370 |
Density |
Normal |
| 0.684 |
1.718 |
0.831 |
0.849 |
3.770 |
0.169 |
0.613* |
- |
- |
Exceedance |
| 46b |
0.767 |
1.682 |
0.380 |
0.648 |
3.839 |
0.116 |
1.171 |
20.562 |
20.661 |
Density |
Normal |
| 0.760 |
1.677 |
0.755 |
0.671 |
3.828 |
0.245 |
0.344* |
- |
- |
Exceedance |
| 46t |
0.707 |
1.762 |
0.425 |
0.793 |
3.593 |
0.150 |
0.682 |
25.296 |
24.821 |
Density |
Normal |
| 0.752 |
1.790 |
0.783 |
0.702 |
3.750 |
0.217 |
0.503* |
- |
- |
Exceedance |
| 47b |
0.612 |
1.451 |
0.320 |
1.059 |
3.889 |
0.051 |
1.240 |
21.862 |
44.329 |
Density |
Normal |
| 0.687 |
1.414 |
0.897 |
0.810 |
4.112 |
0.103 |
0.929* |
- |
- |
Exceedance |
| 47t |
0.790 |
2.042 |
0.668 |
0.475 |
4.324 |
0.056 |
1.812 |
23.420 |
20.671 |
Density |
Normal |
| 0.785 |
2.041 |
0.915 |
0.544 |
4.288 |
0.085 |
0.425* |
- |
- |
Exceedance |
| 48b |
- |
- |
- |
0.713 |
1.917 |
3.534 |
4.794 |
14.734 |
10.367 |
Density |
Normal |
| - |
- |
- |
0.729 |
1.911 |
1.000 |
4.940* |
- |
- |
Exceedance |
| 48t |
0.550 |
1.646 |
0.352 |
1.265 |
2.203 |
0.140 |
0.921 |
29.682 |
14.070 |
Density |
Normal |
| 0.532 |
1.655 |
0.640 |
1.409 |
1.979 |
0.360 |
0.357* |
- |
- |
Exceedance |
| 49b |
0.977 |
2.160 |
0.176 |
0.713 |
3.989 |
0.063 |
0.652 |
23.158 |
21.716 |
Density |
Normal |
| 1.037 |
2.178 |
0.760 |
0.712 |
4.026 |
0.240 |
0.063* |
- |
- |
Exceedance |
| 49t |
0.529 |
1.734 |
0.105 |
1.030 |
2.999 |
0.222 |
0.972 |
22.205 |
27.580 |
Density |
Normal |
| 0.528 |
1.699 |
0.305 |
1.044 |
2.939 |
0.695 |
0.171* |
- |
- |
Exceedance |
| 50b |
0.634 |
1.942 |
2.423 |
0.967 |
2.247 |
1.491 |
4.661 |
24.942 |
27.915 |
Density |
Normal |
| 0.647 |
2.067 |
0.603 |
1.500 |
1.317 |
0.397 |
2.627* |
- |
- |
Exceedance |
| 50t |
0.933 |
2.351 |
0.613 |
0.673 |
4.348 |
0.026 |
0.951 |
28.707 |
25.476 |
Density |
Normal |
| 0.950 |
2.373 |
0.971 |
0.520 |
4.576 |
0.029 |
0.286* |
- |
- |
Exceedance |
* Chi-Square is not adjusted for exceedance
rescaling, and so not reliable. 100 sample points were used for function fit.
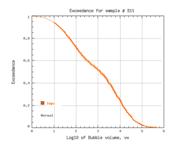
Table 2. Graphs of bubble distributions presented in Table 1.
|
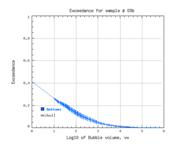
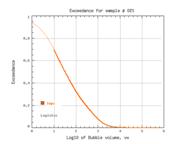
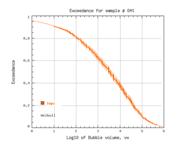
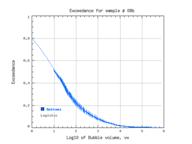
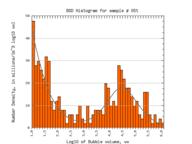
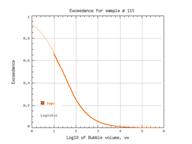

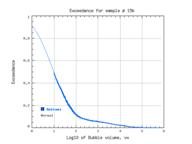
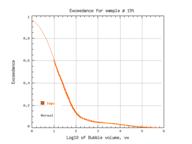
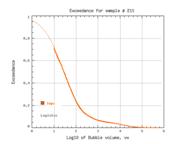 21t (Logistic)